


Data is truly the backbone of any successful business strategy. Many business leaders consider that “data is the new oil”.
Using data insights, can tell a real-time story about your business, its operations, and your customers. When you utilize this information effectively, you can make better decisions for your organization.
However, raw data is difficult to understand and it is for this reason that data visualisation is essential. Business information and analytics are presented in an easy-to-digest visual format in this application.
This sector has been led by Microsoft’s Power BI, the most popular data analytics platform.
What is Power BI? How can businesses use Power BI to make better decisions? What are the top benefits of this platform?
In this article, we’ll give you a complete guide on why your business will benefit from data visualisation through Microsoft’s Power BI.
With Microsoft Power BI, you can transform information & data into immersive & interactive insights. This brilliant tool allows businesses to benefit from stunning self-service analytics.
Using Power BI, you can make informed business decisions without the added cost of hiring data analysts.
What sets Power BI apart from the other data analytics platforms out there? Intuitive and easy to use, Power BI has a Microsoft Office-like interface.
According to Procter and Gamble (P&G), Power BI has helped them innovate and push the envelope — “constructively disrupt how [P&G] operates, leading to growth.” As a result of using this data, they have been able to improve their supply chain and improve their product performance.
As a telecommunications company, T-Mobile used Power BI to improve its data reporting accuracy and provide real-time sales results to guide employees.
So, what is so special about Power BI? Why do leading companies in their respective industries turn to Microsoft for data analysis solutions?
Let’s discuss some of the platform’s top features and benefits!
Power BI is natively feature-rich, with tons of tools that are extremely useful in day-to-day use.
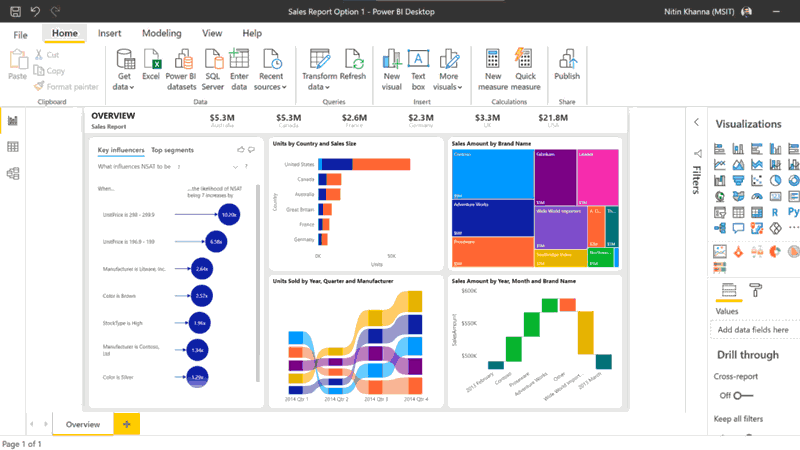
Versatile Visualisations: For data to be actively used, it needs to be displayed in an easy-to-understand way. A map, line graph, pie chart, and pie chart are just some of the ways Power BI allows you to visualize data.
Data visualisation is all about making things easier, and Microsoft meets the mark in that regard.
The elements can be dragged and dropped in any way you want, and you can adjust them easily without having to create new ones and edit them in a separate menu.
Power BI is available on all devices, meaning you can easily access your data both on the go and on alternative devices if need be.
With remote working becoming the norm in modern companies, this versatility is great rather than being tied to a single computer and workspace.
Insights are the best way to be able to improve your organisation’s success. They let you see the most important parts of your data, and where things need to be adjusted.
With Power BI, you can see trends and patterns in your data to gain top-tier insights. You can even create and print paginated reports for sharing with stakeholders.
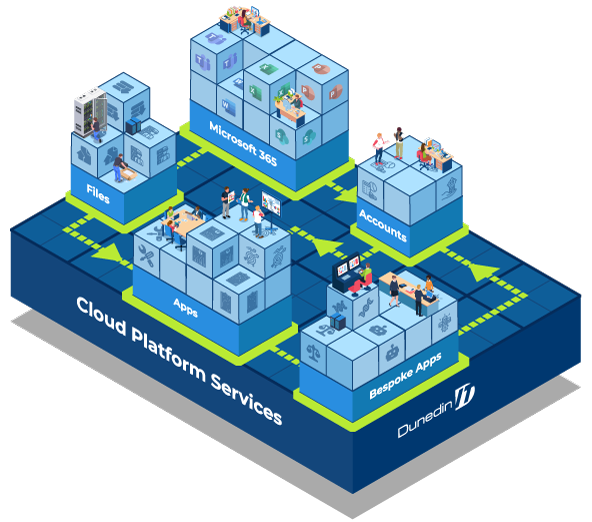
Outwith the day-to-day support of your Cloud Applications like Office 365, and Google Workspace, we’re increasingly engaging with clients on helping them make the most of these platforms.
Within these eco-systems are many Apps that can be integrated and scripted to provide a richer experience.
As the adoption of cloud applications becomes commonplace, the next advancement will be joining these different eco-systems together.
Data is never old with Power Bi’s constant data refresh to ensure your information and insights are up to date and relevant.
This near real-time stream of data enables you to track how your metrics and insights change over time as inputs change. Which ultimately ensures you’re always acting on accurate data and making those informed business decisions.
Unlock your company’s full potential by turning your data into actionable insights using Power Bi. You can easily discover trends, strengths, and weaknesses in your business.
This tool integrates with the rest of Microsoft’s Power Platform to make it easy to turn these insights into action. With Power Apps and Power Automate, you can easily build applications and automate workflows based on guidance provided by BI.
Stand out amongst the rest with Power BI’s integration with machine learning and artificial intelligence giving you even more insight into your data.
By using AutoML (Automated Machine Learning), you can train a model within Power BI on your data and apply that model to any future data, allowing for high-quality predictive insights.
Power BI is easily the most powerful data analysis and visualisation tool on the market. With AI integration and intelligent insights, Power BI truly is the data solution of the future. Its simplicity is unmatched, and it’s also highly customisable and powerful.
With complete Microsoft 365 integration, any company familiar with Microsoft’s services will find it easy to get started. And, its extremely intuitive and simple user interface is hard not to fall in love with.
So, are you ready to take your business to the next level?
“How do I develop a cloud strategy?”
“What do I need to do to prepare for the Cloud?”
“Where do I get started with Power BI”